Quick Overview: Difference between revisions
m (→Learning path: update query (caption)) |
m (→Using the Graph: update image description and size (align with table)) |
||
| (21 intermediate revisions by the same user not shown) | |||
| Line 1: | Line 1: | ||
__NOTOC__ | __NOTOC__ | ||
The goal of '''GraphIT''' is to develop and evaluate a dependency graph of learning contents. | |||
This graph enables faculties to develop better study programs, teachers to structure their courses better and students to find the best way to achieve their personal goals. | |||
{{Note|type=info|text=On each interactive visualization on this page, you can click on the "GraphIT Query Service" link in the lower left corner. This opens a new tab which shows you the SPARQL query and allows you to modify it.}} | |||
= The Dependency Graph = | = The Dependency Graph = | ||
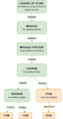
At the lowest level | [[File:Graph-simple.png|thumb|right|650px|Learning contents connect to each other to form a ''learning path'']] | ||
A dependency graph is a collection of ''nodes'' (or items), connected with each other using ''edges'' (or properties), to show which nodes depend on others. For GraphIT the nodes represent a topic of study. | |||
At the lowest level our graph is structured by '''linking learning contents to their prerequisite(s)'''. | |||
Students can use these links to determine how topics depend on each other, and what knowledge is required to understand a specific item. | |||
Materials (such as tutorials and articles) or exams can also be linked to each learning content. | |||
In the end the graph turns into a big interconnected structure: | In the end the graph turns into a big interconnected structure: | ||
[[File:Cgbv dependency full.png|thumb|left||500px|A snippet of the dependency graph]] | |||
<div style="clear: both"></div> | |||
</br> | |||
{{#widget:SPARQLquery|code= | In order to make this amount of data useable, several ''Structure-Items'' have been defined to help group items together. For example learning contents of similar topics are [[Property:P14|included]] in a [[GraphStructure#Category|category]], that can later be referenced when putting a course together. | ||
[[GraphStructure#Course|Courses]] include [[GraphStructure#Session|Session]]-Items (representing an actual session of a course), that also [[Property:P14|include]] all items that are being discussed in person. | |||
{| class="wikitable" | |||
! Items being discussed in a '''[[Item:Q940|session]]''' on 3D-Graphics of the ''CGBV''-course | |||
! All items included in the '''category''' ''[[Item:Q8|3D-Graphics]]'' | |||
|- | |||
| style="width: 64%" | {{#widget:SPARQLquery|code= | |||
#defaultView:Graph | #defaultView:Graph | ||
PREFIX wdt: <https://graphit.ur.de/prop/direct/> | PREFIX wdt: <https://graphit.ur.de/prop/direct/> | ||
PREFIX wd: <https://graphit.ur.de/entity/> | |||
select distinct ?item ?itemLabel ?image ?dependency ?dependencyLabel ?image2 #?session ?sessionLabel | |||
?item wdt: | where { | ||
OPTIONAL{ ?item wdt: | wd:Q940 wdt:P14 ?item. | ||
OPTIONAL {?item wdt:P11 ?image.} | |||
OPTIONAL { | |||
} | ?item wdt:P1 ?dependency. | ||
OPTIONAL {?dependency wdt:P11 ?image2}. | |||
} | |||
FILTER EXISTS {wd:Q940 wdt:P14 ?dependency} | |||
service wikibase:label { bd:serviceParam wikibase:language "en".} | |||
} LIMIT 100 | |||
}} | }} | ||
| style="width: 36%" | {{#widget:SPARQLquery|code= | |||
#defaultView:Table | |||
= | |||
{{#widget:SPARQLquery|code= | |||
#defaultView: | |||
PREFIX wdt: <https://graphit.ur.de/prop/direct/> | PREFIX wdt: <https://graphit.ur.de/prop/direct/> | ||
PREFIX wd: <https://graphit.ur.de/entity/> | PREFIX wd: <https://graphit.ur.de/entity/> | ||
select distinct ?item ?itemLabel | select distinct ?item ?itemLabel | ||
where { | where { | ||
BIND (wd:Q8 as ?category) | |||
?category wdt:P14 ?item. | |||
service wikibase:label { bd:serviceParam wikibase:language "en".} | service wikibase:label { bd:serviceParam wikibase:language "en".} | ||
} | } | ||
}} | }} | ||
|} | |||
== | </br> | ||
{| class="wikitable" style="float:right; width:40em; margin-left:5px" | |||
! The '''User-Item''' of a ''[[Item:Q157|student]]'' and all items connected to it | |||
|- | |||
| | |||
{{#widget:SPARQLquery|code= | {{#widget:SPARQLquery|code= | ||
#defaultView:Graph | #defaultView:Graph | ||
| Line 64: | Line 69: | ||
PREFIX wd: <https://graphit.ur.de/entity/> | PREFIX wd: <https://graphit.ur.de/entity/> | ||
SELECT ?item1 | SELECT ?item1 ?item1Label ?item2 ?item2Label ?edgeLabel ?rgb ?shape WHERE { | ||
VALUES ?item1 {wd:Q157} | VALUES ?item1 {wd:Q157} | ||
?item1 ?prop ?item2. | ?item1 ?prop ?item2. | ||
?edge ?dummy ?prop ; rdf:type wikibase:Property. | ?edge ?dummy ?prop ; rdf:type wikibase:Property. | ||
# Minus username in edgeLabel | |||
FILTER (?prop != wdt:P28) | |||
# Color Coding: | # Color Coding: | ||
| Line 75: | Line 83: | ||
if(?prop = wdt:P23, "ffeec2", # interested in (orange) | if(?prop = wdt:P23, "ffeec2", # interested in (orange) | ||
"FFFFFF" ))) as ?rgb). | "FFFFFF" ))) as ?rgb). | ||
# Shape Coding: | |||
BIND (if(?prop = wdt:P25, "text", # participates in | |||
if(?prop = wdt:P12, "ellipse", # has completed | |||
if(?prop = wdt:P23, "box", # interested in | |||
"text" ))) as ?shape). | |||
SERVICE wikibase:label { bd:serviceParam wikibase:language "[AUTO_LANGUAGE],en". } | SERVICE wikibase:label { bd:serviceParam wikibase:language "[AUTO_LANGUAGE],en". } | ||
} ORDER BY ?prop | } ORDER BY ?prop | ||
| A User-Item of a student and all items connected to it | |||
}} | }} | ||
|} | |||
Every item can further include existing [[GraphStructure#Properties|properties]]. This allows for specifying information such as a date, expressing interest, people responsible and URLs. | |||
People can interact with the graph by creating a '''User-Item''' (example: [[Item:Q157|Max Mustermann]]), that they can use to link back to items in different ways. | |||
For a more '''detailed explanation''' of the entire underlying structure go to [[GraphStructure]] or take a quick look at these following diagrams: | |||
<gallery> | |||
File:Graph-structure.png | The base structure | |||
File:Graph-structure-Course.png | Connection of courses | |||
</gallery> | |||
= Using the Graph = | |||
The graph itself is just a versatile data structure. In order to make it usable, we are developing tools and visualizations. The [https://www.w3.org/TR/sparql11-query/ SPARQL] query language offered by WikiBase allows for retrieving relevant parts of the graph and visualizing it in different ways. This can offer insights on about the contents of the graph, but also the graph itself and it's underlying structure. | |||
We combine different visualization to create a course page (see for example: [[Courses/WissenschaftlichesArbeiten|WissArb]] and [[Courses/CGBV_SS24|CGBV]]), where a collection of information is contained in one place. | |||
<div style="clear: both"></div> | |||
Such as a '''timeline''' of all course sessions: | |||
<div style="border: solid 5px #d2d6e0; background-color:#eaecf0;"> | |||
{{#widget:SPARQLquery|code= | {{#widget:SPARQLquery|code= | ||
#defaultView:Timeline | |||
# title: Alle geplanten Termine | |||
PREFIX wdt: <https://graphit.ur.de/prop/direct/> | |||
PREFIX wd: <https://graphit.ur.de/entity/> | |||
select distinct ?Datum ?Inhalte ?InhalteLabel | |||
# ?item # for debug | |||
where { | |||
# todo. change Q:468 to current course | |||
wd:Q932 wdt:P14 ?Inhalte. | |||
?Inhalte wdt:P3 wd:Q427. | |||
?Inhalte wdt:P19 ?Datum. | |||
OPTIONAL { ?Inhalte skos:altLabel ?InhalteLabel. # get alias instead of label | |||
FILTER (!regex(?InhalteLabel, "CGBV", "i")) } | |||
service wikibase:label { bd:serviceParam wikibase:language "en".} | |||
} ORDER BY ASC(?Datum) | |||
| height=38em | |||
| caption=All sessions of the CGBV course | |||
}} | |||
</div> | |||
</br> | |||
Or an overview of students [[Property:P12|knowledge]] and [[Property:P23|interests]]: | |||
<div style="border: solid 5px #d2d6e0; background-color:#eaecf0;"> | |||
{{#widget:SPARQLquery|code= | |||
#defaultView:SwarmScatterChart | |||
PREFIX wd: <https://graphit.ur.de/entity/> | |||
PREFIX wdt: <https://graphit.ur.de/prop/direct/> | |||
SELECT DISTINCT ?known ?interests ?itemLabel # ?known ?interests ?item ?itemLabel | |||
WHERE { | |||
wd:Q468 wdt:P14* ?item. | |||
OPTIONAL { | |||
SELECT ?item ?itemLabel (COUNT(DISTINCT ?student) as ?known) WHERE { | |||
?student wdt:P12 ?item. | |||
} GROUP BY ?item ?itemLabel | |||
} | |||
OPTIONAL { | |||
SELECT ?item ?itemLabel (COUNT(DISTINCT ?student) as ?interests) WHERE { | |||
?student wdt:P23 ?item. | |||
} GROUP BY ?item ?itemLabel | |||
}. | |||
BIND (IF(!BOUND(?interests), 0, ?interest) as ?interests). | |||
BIND (IF(!BOUND(?known), 0, ?known) as ?known). | |||
SERVICE wikibase:label { bd:serviceParam wikibase:language "[AUTO_LANGUAGE],en". } | |||
} | |||
| caption=Students self defined interests and prior knowledge for learning contents of the WissArb-Course | |||
| height=20em | |||
}} | |||
</div> | |||
<small>Such a graph is possible by allowing students to modify their personal user-item and use it to link to items with the properties: [[Property:P12|has completed]] and [[Property:P23|interested in]]. </small> | |||
Or | |||
{| class="wikitable" | |||
! '''Learning paths''' to show the step-by-step path towards learning a topic (here: [[Item:Q149| Virtual Cameras]]) | |||
! The most important ''categories'' the course talks about | |||
|- | |||
<!-- Linke Spalte --> | |||
| style="width: 60%" | {{#widget:SPARQLquery|code= | |||
#defaultView:Graph | #defaultView:Graph | ||
# prerequisite -> topic -> postrequisite | # prerequisite -> topic -> postrequisite | ||
| Line 97: | Line 190: | ||
} UNION { | } UNION { | ||
VALUES ?topic { wd:Q149 } # we also want to include the root node itself | VALUES ?topic { wd:Q149 } # we also want to include the root node itself | ||
} | } | ||
} | } | ||
} | } | ||
?topic wdt:P1 ?pre. | ?topic wdt:P1 ?pre. | ||
BIND (?topic as ?v). # + add all ?pre that are not yet in ?topic | BIND (?topic as ?v). # + add all ?pre that are not yet in ?topic | ||
| Line 108: | Line 199: | ||
} | } | ||
} | } | ||
Union | Union | ||
{ SELECT * WHERE { | { SELECT * WHERE { | ||
{ SELECT ?topic ?topicLabel ?goal ?goalLabel WHERE { | { SELECT ?topic ?topicLabel ?goal ?goalLabel WHERE { | ||
| Line 127: | Line 216: | ||
} | } | ||
} | } | ||
SERVICE wikibase:label { bd:serviceParam wikibase:language "[AUTO_LANGUAGE],en". } | SERVICE wikibase:label { bd:serviceParam wikibase:language "[AUTO_LANGUAGE],en". } | ||
} | } | ||
} | | } | ||
}} | |||
<!-- Rechte Spalte --> | |||
| style="width: 40%" | {{#widget:SPARQLquery|code= | |||
#defaultView:BubbleChart | |||
PREFIX wd: <https://graphit.ur.de/entity/> | |||
PREFIX wdt: <https://graphit.ur.de/prop/direct/> | |||
SELECT DISTINCT ?category ?categoryLabel ?items | |||
WHERE { | |||
wd:Q932 wdt:P14 ?category. | |||
?category wdt:P3 wd:Q169. | |||
{ | |||
SELECT ?category ?categoryLabel (COUNT(DISTINCT ?item) as ?items) WHERE { | |||
?category wdt:P14 ?item. | |||
} GROUP BY ?category ?categoryLabel | |||
} | |||
filter (?items>=8) | |||
SERVICE wikibase:label { bd:serviceParam wikibase:language "[AUTO_LANGUAGE],en". } | |||
} | |||
}} | }} | ||
|} | |||
== Custom Frontends == | |||
[[File:Visual-Editor-screenshot.png|thumb|right|460px|A '''visual editor''' for graph exploration and marking items]] | |||
[[File:Table-Editor-Screenshot2.png|thumb|right|460px|A '''tabular editor''' for modifiying and connecting items]] | |||
For an easier and more direct way of interaction some custom frontends have been developed. | |||
Students can interact with the graph using a '''[https://test.graphit.ur.de/app/src/pages/selectionTools/ visual editor]'''. | |||
It shows a specific course and all items it includes. It allows students to explore the graph, see learning paths towards specific topics and quickly mark items as [[Property:P12|prior knowledge]] or a topic that they are [[Property:P23|interested in]]. | |||
Admins can interact with a '''tabular editor''', that can modifiy items dependently and independently of each other. They can move, copy or delete ''statements'' (property-item-pairs) between items and create new connections. | |||
= Plans for the Future = | |||
We want to implement: | |||
* Evaluation and implementation of a suitable infrastructure (based on Wikibase) | |||
* Structuring the content of a course of study as a dependency graph | |||
* Continuous evaluation of the usage through pilot projects in courses, in the planning/revision of a degree program and for individual learning paths, e.g. for career changers | |||
* Integration of OER | |||
* Analysis of the course of study aggregated and in person | |||
* Development of tools for visualizing and processing the data | |||
* Preparation for scaling the concept to university / national / international level | |||
Cooperation with other partners is planned, in particular with developers in the area of Wikibase / graph databases and application partners from the public sector. | |||
Latest revision as of 09:01, 14 April 2025
The goal of GraphIT is to develop and evaluate a dependency graph of learning contents.
This graph enables faculties to develop better study programs, teachers to structure their courses better and students to find the best way to achieve their personal goals.
ℹ️ On each interactive visualization on this page, you can click on the "GraphIT Query Service" link in the lower left corner. This opens a new tab which shows you the SPARQL query and allows you to modify it.
The Dependency Graph

A dependency graph is a collection of nodes (or items), connected with each other using edges (or properties), to show which nodes depend on others. For GraphIT the nodes represent a topic of study.
At the lowest level our graph is structured by linking learning contents to their prerequisite(s). Students can use these links to determine how topics depend on each other, and what knowledge is required to understand a specific item. Materials (such as tutorials and articles) or exams can also be linked to each learning content.
In the end the graph turns into a big interconnected structure:

In order to make this amount of data useable, several Structure-Items have been defined to help group items together. For example learning contents of similar topics are included in a category, that can later be referenced when putting a course together. Courses include Session-Items (representing an actual session of a course), that also include all items that are being discussed in person.
| Items being discussed in a session on 3D-Graphics of the CGBV-course | All items included in the category 3D-Graphics |
|---|---|
| The User-Item of a student and all items connected to it |
|---|
|
|
Every item can further include existing properties. This allows for specifying information such as a date, expressing interest, people responsible and URLs.
People can interact with the graph by creating a User-Item (example: Max Mustermann), that they can use to link back to items in different ways.
For a more detailed explanation of the entire underlying structure go to GraphStructure or take a quick look at these following diagrams:
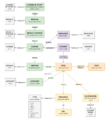
The base structure
Connection of courses


Using the Graph
The graph itself is just a versatile data structure. In order to make it usable, we are developing tools and visualizations. The SPARQL query language offered by WikiBase allows for retrieving relevant parts of the graph and visualizing it in different ways. This can offer insights on about the contents of the graph, but also the graph itself and it's underlying structure.
We combine different visualization to create a course page (see for example: WissArb and CGBV), where a collection of information is contained in one place.
Such as a timeline of all course sessions:
All sessions of the CGBV course
Or an overview of students knowledge and interests:
Students self defined interests and prior knowledge for learning contents of the WissArb-Course
Such a graph is possible by allowing students to modify their personal user-item and use it to link to items with the properties: has completed and interested in.
Or
| Learning paths to show the step-by-step path towards learning a topic (here: Virtual Cameras) | The most important categories the course talks about |
|---|---|
Custom Frontends


For an easier and more direct way of interaction some custom frontends have been developed.
Students can interact with the graph using a visual editor. It shows a specific course and all items it includes. It allows students to explore the graph, see learning paths towards specific topics and quickly mark items as prior knowledge or a topic that they are interested in.
Admins can interact with a tabular editor, that can modifiy items dependently and independently of each other. They can move, copy or delete statements (property-item-pairs) between items and create new connections.
Plans for the Future
We want to implement:
- Evaluation and implementation of a suitable infrastructure (based on Wikibase)
- Structuring the content of a course of study as a dependency graph
- Continuous evaluation of the usage through pilot projects in courses, in the planning/revision of a degree program and for individual learning paths, e.g. for career changers
- Integration of OER
- Analysis of the course of study aggregated and in person
- Development of tools for visualizing and processing the data
- Preparation for scaling the concept to university / national / international level
Cooperation with other partners is planned, in particular with developers in the area of Wikibase / graph databases and application partners from the public sector.