Main Page: Difference between revisions
(is - was) |
|||
| Line 199: | Line 199: | ||
You can also find us on the [https://discord.gg/vHDS6crnDj GraphIT Discord server] | You can also find us on the [https://discord.gg/vHDS6crnDj GraphIT Discord server] | ||
The project | The project was supported by a [https://www.uni-regensburg.de/zentrum-hochschul-wissenschaftsdidaktik/freiraum/index.html#content_toggle_26218 small grant] from the Bavarian State Ministry for Science and the Arts via the [https://www.uni-regensburg.de/centre-for-university-and-academic-teaching/the-cuat/index.html Center for University and Academic Teaching (ZHW)] at the University of Regensburg. | ||
Revision as of 08:42, 5 May 2025
Welcome to GraphIT
This project at the University of Regensburg (UR) investigates how dependency graphs can be used to model courses, curricula, and personal learning progress. The initial focus lies on courses in higher education. This graph is built on Wikibase, the knowledge-graph platform powering Wikidata.
Since May 2023 we've used this prototype to explore and examine ways to structure the graph, present its information and increase its usability. We've fully modelled four courses of the degree program for media informatics at the UR and tested them alongside lectures. We've explored different experimental frontends and visualizations to make interaction with the data simpler and more efficient.
As of 2025, development on this first prototype has slowed as we are currently planning to expand the project further.
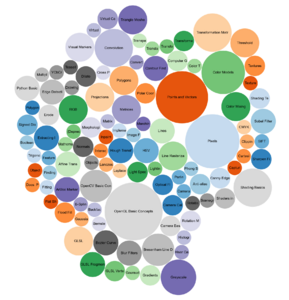
Here's a preview of the dependency graph currently in the prototype. Please scroll down to learn more about the project or explore the platform via the menu at the top.
One hundred topics from the GraphIT dependency graph. Click below for the full dependency graph.
Complete Dependency Graph containing all items on GraphIT.
Important: This platform is always work in progress. Please let us know if you find problems or find that important information is missing. Editing the graph is only allowed for registered users.
Dive Right In
The following pages give a good overview of concepts and content within GraphIT. If you want to learn more about the motivation and ideas behind the project, please read on below this block.
| Quick_Overview | |
|---|---|
| This page gives you a quick overview of the project, its structure and how you can use it. | |
| GraphStructure | |
|---|---|
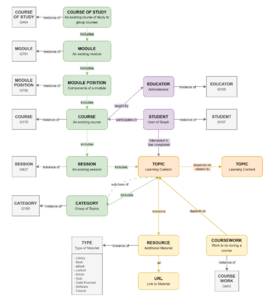
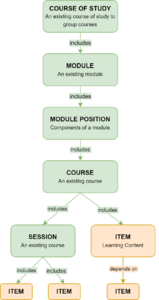
| This page contains a detailed documentation of the graph structure and how it is used to organize the graph using diagrams and example queries. | |
| ExampleStudent | |
|---|---|
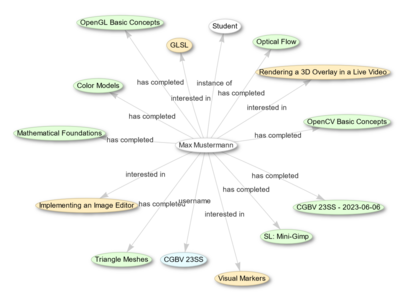
| This page show how to a student can use the graph to organize their curriculum and to view their personal usage of it. | |
| Student_Use | |
|---|---|
| This page can give you an overview over your own graph and linked items. | |
| Courses/CGBV | |
|---|---|
| This page gives an overview and helpful queries over the course "Computergraphik und Bildverarbeitung", to show what the graph can do to give students an overview of the course of study, fundamentals usefull items and their prerequisites. | |
| Quiz/CGBV-SL2 | |
|---|---|
| This page gives an example on how coursework can be incorporated in and used by the graph | |
| Feature_Demo | |
|---|---|
| This page gives a couple of examples of what the graph can do. | |
Why GraphIT?
What should students learn? Which topics should be covered in a given course of study? These are difficult questions:
The more the knowledge of mankind grows, the more specialized the courses need to be that a university offers. Of course, specialized courses can no longer cover the same breadth of knowledge as classical courses of study. Therefore, we need to constantly redefine what the essential core of a subject is.
On the other hand, in a networked world, interdisciplinary courses of study are valuable. In these, we can no longer teach knowledge and competencies of the parent subjects in the same depth, but must redefine which of these are absolutely necessary for the study goal.
At the same time, students' prior knowledge is becoming more and more heterogeneous due to more open educational pathways and opportunities for digital learning. Also, their goals and opportunities differ a lot. A "one-size-fits-all" degree program will do less and less justice to these students. Instead, we need to find ways to support students in their individual learning goals and speeds while providing them with guidance, support, and education.
Our processes for developing curricula and courses no longer meet these complex and ever-changing demands. Manual labor and gut instinct still prevail in the organization of studies and the development of curricula.
Basic Concept
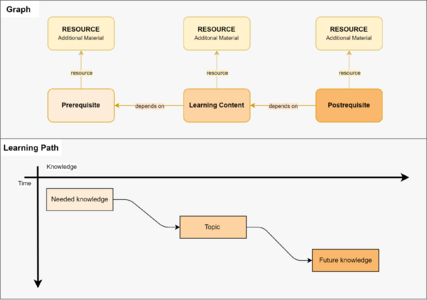
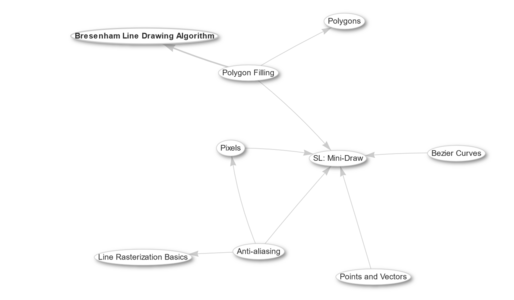
In the GraphIT project, we develop a dependency graph of learning topics. Each node in the graph represents a learning topic (or topic) . An edge in the graph indicates which further topics build on the current topic (i.e., depend on it).
Such a graph can structure the content of a single course, a curriculum, a discipline, a university, or the whole world (in theory :) ).
For any given topic, the necessary prerequisites can be retrieved from the graph. Linking open educational resources (OER) or examinations to the graph offers students a flexible tool for self-study and self-assessment.
Applications
Envisioned applications:
Educators
- collect topics and build curricula and course syllabi
- identify central and irrelevant topics by looking at the graph
- attach OER and other resources to topics and re-use these
- create optimal paths through a curriculum, i.e. identify which topics should be taught in which order
- monitor students' progress and identify bottlenecks, i.e. topics where many students struggle
- ...
Students
- follow a pre-defined or custom path through a set of topics
- find out what the best path to learning a certain skill is
- track own achievements and compare to individual goals or others
- find new, interesting things one can learn with the knowledge one already has
- better understand the contents and study goals of a course or the curricula
- take part in developing applications using the graphs data
- compare existing knowledge and future interests to the offered curricula
- ...
(Do you have further suggestions? Please tell us via Discord or email!)
Questions and Challenges
There are quite a few obvious and less obvious challenges and open questions. The goal of the GraphIT project is to explore these questions by implementing a prototype and evaluating it in practice.
- Can this concept really work?
- How large should a topic be in order to be both useful an manageable?
- Learning is more complex than just 'checking off' topics that one has learned. How do we include repetitions, different grades of learning (c.f. Bloom's taxonomy), or 'soft skills' in such a graph?
- How could one use this graph?
- Which tools are needed in order to efficiently work with a really large graph? (We are developing these at the moment)
- Can intelligent tools (AI!) help with managing, modifying, and updating a large graph?
- Which visualizations and aggregations of the graph are most helpful?
- How can people from different disciplines and institutions, and with different viewpoints collaborate within one large graph?
- Should there be one large graph or many small ones?
- How can we build a platform that is as open and flexible as possible while still maintaining consistency and protecting personal data?
Status and Roadmap
As of May 2024, we are actively using GraphIT in individual courses and building new tools for working with the data in the graph. We are also working on a paper about concept and implementation.
Previously, we discussed the concept with a few people, developed a prototype (also using Wikibase) that we scrapped again, and researched related projects, finalized our infrastructure, and built experimental graphs.
In May 2024, Raphael Wimmer gave a small presentation about GraphIT at the KI-Campus Tool Tip Tuesday (YouTube, 35 minutes, German).
Since the start of 2025 we are actively planning to expand on this prototype with further requirements, data and frontends.
Timeline of the Graph
A short overview on how the graph and its data has developed over time
- Spring 2023: brainstorming of initial graph structure based on a previous student project
- May 2023: modeling the first course (course) accordingly
- August 2023: documenting the initial graph structure
- October 2023: modeling a second smaller course (WissArb) and adjusting the data structure and link directions (categories now link to items instead of items linking to categories)
- December 2023: attempt at modelling third course (FS MMI), but not enough resources and lack of structured data
- January 2024: modelling dummy version of full curricula to show connections between courses
- March/April 2024: update data for next iteration of CGBV and WissArb
- September/October 2024: modelling two more courses (ASE and MMT)
- February 2025: change to data structure for courses (stop linking to categories)
About / Contact
This is a project by the Physical Digital Affordances Group / Chair of Media Informatics at the University of Regensburg
Primary contact: Raphael Wimmer (email)
Current Contributors: Leonie Schrod
Past Contributors: Alexander Weichart
You can also find us on the GraphIT Discord server
The project was supported by a small grant from the Bavarian State Ministry for Science and the Arts via the Center for University and Academic Teaching (ZHW) at the University of Regensburg.
