Quick Overview
The goal of GraphIT is to develop and evaluate a dependency graph of learning contents.
This graph enables faculties to develop better study programs, teachers to structure their courses better and students to find the best way to achieve their personal goals.
The Dependency Graph

A dependency graph is a collection of nodes, connected with each other using edges. These connections show which nodes depend on others. These nodes or items represent a topic of study.
At the lowest level our graph is structured by linking learning contents to their prerequisite(s). A student can now use these links to determine how items depend on each other, and what knowledge is required to understand a specific node. Materials (such as tutorials and articles) or exams can also be linked to each learning content.
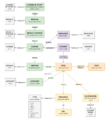
In the end the graph turns into a big interconnected structure:

In order to make this amount of data useable, several Structure-Items have been defined to help group items together. For example learning contents of similar topic are included in a category that can later be referenced when putting a course together. Courses include Sessions that represent an actual session of a course and include all items that are being discussed in person.
Items being discussed in a session of the ''CGBV''-course on 3D-Graphics
Every item can further include existing Properties. This allows for specifying information such as dates, people responsible and URLs.
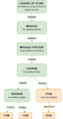
For a more detailed explanation of the entire underlying structure go to GraphStructure or take a quick look at these following diagrams:
The base structure
Connection of courses


Using the Graph
The graph itself is just a versatile data structure. In order to make it usable, we are developing tools and visualizations. The SPARQL query language offered by WikiBase allows for retrieving relevant parts of the graph and visualizing it in different ways.
ℹ️ On each interactive visualization on this page, you can click on the "GraphIT Query Service" link in the lower left corner. This opens a new tab which shows you the SPARQL query and allows you to modify it.
Students can use the graph in various ways. For example using a course page (see for example: WissArb and CGBV), where a collection of information is contained.
Such as a timeline of all course sessions:
All sessions of the CGBV course
Or an overview of students knowledge and interests:
Students self defined interests and prior knowledge for learning contents of the WissArb-Course
Such a graph is possible by allowing students to modify their personal user-item and use it to link to items with the specific properties: has completed and interested in.
Custom Frontends
Students can also interact with the graph
Overview of Student
Shows what items a Student is has linked their item to. Can be used to track progress.
Learning path
The complete path to an item (here: Virtual Cameras) and what's next.
The learning path to an item, showing its pre- and postrequisites
Course Work
What items are used in a mandatory coursework:
The learning path to wd:Q451